
Filter Press Detailed Test Procedures
6.1 Sources
The sources for the test procedures include AWWA Standard Methods, standard industry tests, standard laboratory techniques, and specially developed procedures.
6.2 General Laboratory Techniques
6.2.1 Solution Preparation
There are several methods used to describe the concentration of a solutions, most of these methods are very valuable in a chemistry lab but not very convenient for us. The two descriptions that are most useful are “w/w%” and “w/v%”. The first, “w/w%” is called weight or weight to weight percent. The second, “w/v%”, is called weight to volume percent or sometimes incorrectly called weight percent also.
The liquid that is used to dissolve the other material in (liquid or solid) is called the solvent; normally water is the solvent. The material being dissolved in the solvent is called the solute. A terminology note, sometimes the term solvent is used to mean various “organic” liquids such as hexane, toluene, acetone, or ethanol (ethyl alcohol or booze) that are commonly used as solvents in the lab.
Weight to weight percent is based on the solute weight divided by the total solution weight (the solute and solvent weights added together). For example an 8% w/w solution in water would be made up as follows: 8 gm of the solute is dissolved in 92 gm of water and the total solution weighs 100 gm, thus 8gm/100gm × 100 = 8%.
To prepare a weight to weight percent solution, the following procedure is used:
- Determine the total amount of solution needed
- Determine the amount of solute needed
- Determine the amount of solvent needed
- Weigh the solute
- Weigh the solvent
- Dissolve the solute into the solvent
To prepare a weight to volume percent solution, the following procedure is used:
- Determine the total amount of solution needed
- Determine the amount of solute needed
- Determine the volume of solvent needed
- Weigh the solute
- Measure the solvent volume
- Dissolve the solute into the solvent
Technique Notes
- Note that water has a density of 1 gm/ml (92 ml of water weighs 92 gm) thus the weight of water in grams is the same as its volume in milliliters (ml) All other solvents must be weighed.
- When preparing a slurry such as “milk of lime” the above procedure is used except that the lime or insoluble solid will be suspended not dissolved.
- Weight to volume percent is based on the solute weight divided by the volume of the solvent. For example a 0.1% w/v% solution in any solvent would be made up as follows: 1 gm of the solvent is dissolved in 1000 ml (1 l) of the solvent: 1gm/1000ml × 100 = 0.1%.
- “W/v%” solutions are typically used when making up polymer solutions, which consist of a water soluble polymer dissolved in water.
- When the solvent is water and the solution is dilute (less than 1%) the difference between w/w% and w/v% is insignificant
6.2.2 Total Solids
This procedure is adapted from the Standard Methods for the Examination of Water and Wastewater. It is drying a very well mixed slurry sample in an oven at 103 – 105°C until dry. This procedure is applicable to slurries and filter cakes
When determining the total solids of the slurry, the slurry must be well mixed so that the sample is homogeneous and representative of the entire slurry.
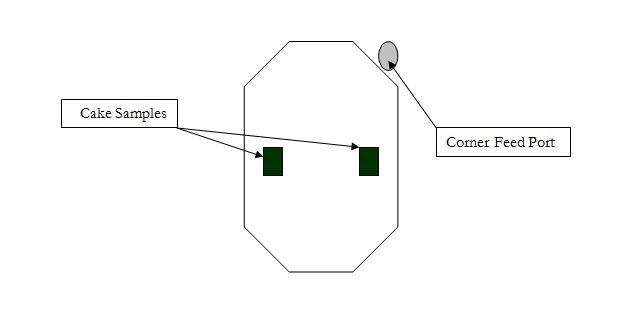
When determining the total solids of the filter cake, a representative sample of the cake must be taken. Normally this sample is from middle area of the cake as shown in Fig. 1 and Fig. 2 for a center feed and corner feed filter press. The core area and cake edges should be avoided because the core is usually the wettest area while the cake edges are the driest.
Terminology Note
A tare is container that is weighed and used to hold a sample while the sample is being dried.
Equipment
Balance
Evaporating dishes or oven proof weighing dish (the “tare”)
Drying oven
Thermometer for drying oven
Procedure
- Weigh a clean, dry evaporating dish (the “tare”).
- Add either the well-mixed slurry or a piece of the filter cake to the evaporating dish, volume is not critical.
- Weigh the evaporating dish with the sample.
- Place the sample into the drying oven with the temperature set at ~ 98°C to reduce the liquid volume without splattering.
- Increase the oven temperature to 103 – 105°C overnight.
- When dry, remove the sample from the oven and cool to room temperature.
- Weigh the evaporating dish and dry sample.
- Calculate the %solids (see below)
Technique notes
- Whenever possible all the samples should be done in duplicate so that any normal variations due sampling problems and sample variation are take into account.
- Filter cake samples for center feed plates should be taken about halfway to two-thirds out from core area to the outside edge of the plate about halfway up from the bottom to the top.
- Filter cake samples for corner feed plates should be taken about center of the cake.
- The evaporating dish can either be porcelain or aluminum.
- If dried overnight the sample can be considered to be at constant weight.
Calculations
Sample weight:
Sample Weight with Tare Weight – Tare Weight = Sample Weight
Dry sample weight:
Dried Sample Weight with Tare Weight – Tare Weight = Dried Sample Weight
% Solids:
(Dried Sample Weight / Sample Weight) × 100 = % Solids
Example
Item Wet Dry
Sample + Tare 58.39 gm 12.78 gm
Tare (weighing dish) 1.57 gm 1.57 gm
Sample 56.82 gm 11.21 gm
% Solids
(11.21 gm / 56.82 gm) × 100 = 19.73 % total dry solids
Figure 1. Cake Samples from Center Feed Cake
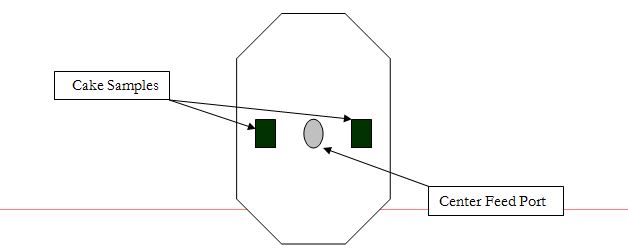
Figure 2. Cake Sample from Corner Feed Cake
6.2.3 Total Suspended Solids
This procedure is adapted from the Standard Methods for the Examination of Water and Wastewater and is used to determine the total suspended solids in the filtrate. This test will quantify the clarity of the filtrate.
Equipment
Drying oven
Analytical Balance (4 or 5 place)
Glass fiber filter
Filter holder
Suction (side arm flask)
Vacuum source (or vacuum pump)
Graduate cylinder
Procedure
- Place the filter in the filter holder, turn on the vacuum pump
- Rinse the filter with 20 ml distilled water three times, discard the liquid
- Dry the filter in the oven for 1 hour at 103 – 105°C
- Remove the filter and cool
- Weigh the filter
- Place the filter in the filter holder, turn on the vacuum pump
- Measure the volume of a sample of the composite filtrate, usually 100 ml or 200 ml
- Pour the sample through the filter
- Rinse the filter and sample with three 10 ml portions of distilled water
- Dry the filter and sample in the oven overnight at 103 – 105°C
- Remove the filter and cool
- Weigh the filter and sample
- Calculate the suspended solids
Technique notes
- If the filter and sample are dried overnight, it can be assumed to be at constant weight.
Calculations
Dry sample weight:
Dried Sample Weight with Tare Weight – Tare Weight = Dried Sample Weight
Suspended Solids:
Dried Sample Weight, mg / Sample Volume, l = Suspended Solids mg/l (ppm)
Note the units are mg (milligram = g × 1000) and l (liter = ml/1000)
Example
Sample + Tare 1.3256 gm dry weight
Tare − 1.2993 gm
Sample 0.0263 gm of suspended solids
26.3 mg of suspended solids
Volume Filtered 250 ml (or 0.250 l)
Suspended Solids, ppm (mg/l)
26.3 mg / 0.250 l = 105 ppm (mg/l) of suspended solids
6.2.4 Liquid Density
This procedure is for all slurries. The slurry must be well mixed. It determines the density of the slurry (mass or weight/volume). Note that specific gravity is the density of the slurry relative to the density of water and has no units.
Equipment
Graduated cylinder (usually 100 ml)
Balance
Procedure
- Weigh a clean, dry graduate cylinder
- Fill the cylinder to its maximum volume marked on the cylinder, this is the sample volume
- Weigh the full cylinder, the difference in weight is the weight of the sample
Technique Notes
- Accurate volume measurements can be difficult with very viscous slurries.
- Many electronic balances have a “tare” or “zero” feature that allows for setting the balance to zero with graduated cylinder on it. When using this feature the balance will display the weight of the empty cylinder as zero and only the sample weight will be displayed with the full cylinder. Consult the operating manual for the balance for detailed instructions if this feature is available.
Calculations
Sample weight:
Sample Weight with Tare Weight – Tare Weight = Sample Weight
Sample Density:
Sample Weight, gm / Sample Volume, ml = Sample Density gm/ml
Conversion to English Units:
(Sample Density, gm/ml × 8.34 lbs/gal) / (Density of Water 1.00 gm/ml) = Sample Density, lbs/gal
Example
Sample Volume = 100.0 ml
Sample Weight = 102.38 gm
Density – Metric Units:
102.38 gm / 100 ml = 1.024 gm/ml
Density – English Units:
(1.024 gm/ml × 8.34 lbs/gal) / 1.000 gm/ml = 8.54 lbs/gal
6.2.5 Solid (Cake) Density
This procedure is used to determine the volume and density of irregularly shaped solid samples and is based on “The Method of Archimedes”. The solid must not be soluble in the liquid used and there must not be any air pockets in the solid. The solid must also sink to the bottom of the liquid. A representative sample of filter cake is required.
Equipment
Balance
Graduated Cylinder (1000 ml works best)
Procedure
- Weigh about 250 gm sample of the solid
- Fill the 1000 ml graduated cylinder about half full and note the volume. The liquid is usually water but any liquid that the solid is insoluble in and denser than will be suitable.
- Carefully add the solid to the graduated cylinder to avoid splattering.
- Note the final volume on the graduated cylinder.
Technique Notes
- If the solid floats a less dense liquid must be used that the solid is insoluble in.
- Hydrophobic (“water fearing”) solids that have a density slightly greater than water may appear to float due to surface tension. To prevent this, use large pieces of the solid to reduce the surface area and the surface tension.
- For best results, a cake density of all the cakes formed in the press should be obtained and the final, reported value is an average of all the densities.
Calculations
Solid Volume:
Final Volume (with solid), ml – Initial volume (no solid), ml = Volume of Solid, ml
Solid Density:
Weight of Solid, gm / Volume of Solid, ml = Density of Solid, gm/ml (also kg/l)
Conversion to English Units:
(Sample Density, gm/ml × 62.4 lbs/ft³) / Density of Water (1.00 gm/ml) = Sample Density, lbs/ft³
Example
Final Volume with Cake 657 ml
Initial Volume without Cake − 500 ml
Cake Volume 157 ml
Cake Weight 189 gm
Cake Density – Metric:
189 gm / 157 ml = 1.20 gm/ml or kg/l
Cake Density – English:
(1.20 gm/ml × 62.4 lbs/ft³) / 1.00 gm/ml = 74.9 lbs/ft³
6.2.6 Cake Thickness
This procedure is used to determine the final cake thickness. This parameter is very important in sizing membrane filter presses and is very useful in verifying the actual cake thickness of the recessed chamber press.
Equipment
Ruler, tape measure or other measuring device with metric units.
Procedure
- Select a piece of cake that is not near the edges and feed area, making sure that the piece is a complete cross-section of the cake.
- Measure the thickness across the cross section and record, the measurement is in millimeters, mm.
- Repeat on each cake formed in the press
Technique Notes
- On larger cakes, several thicknesses may be taken for each cake and the thickness averaged for each cake.
- The final reported cake thickness is the average of the thicknesses of each cake.
- The cake surface will normally have some of the ribbing or pip pattern on it.
Calculations
None
6.3 Buchner Funnel Test
6.3.1 Introduction
The Buchner Funnel is intended to determine the filterability of raw and conditioned slurries. It is a relative test for determining the proper dosage for improved filterability but it can not be used for filter press sizing.
The Buchner Funnel consists of a vacuum (sidearm) flask, mounting collar, Buchner funnel, and vacuum source.
A filter paper is placed on the funnel and wetted and the vacuum turned on, the slurry is added and time for all the liquid to be sucked into the vacuum flask is measured
After the test is done the filtrate volume is measured, the filtrate quality is determined, the cake quality is determined, and the cake release from the paper is determined. The last three parameters are estimated visually on a 1 – 5 scale per descriptions given later.
6.3.2 Polymer Testing
Since polymers have a wide range of characteristics including charge type, charge density, molecular weight, and differences in chemical behavior, several polymers are tested to determine the most suitable ones for the filter press. Most waste slurries are best flocked by polymers with relatively narrow range of characteristics. If one does not know the typical polymers used on the waste slurry, one can consult with either your R&B salesman or the polymer vendors directly for suggested polymers.
Polymer samples are available from various manufacturers. There are four polymer forms: dry, emulsion, liquid, and Mannich. Normally we evaluate only dry, emulsion, and liquid polymers. As far as which form to use, that is one’s preference. Dry polymers have 100% active content (all polymer) while the others have active contents ranging from about 5% for a Mannich polymer to 30 to 50% for an emulsion or dispersion type polymer. The polymer manufacturer will need to advise what the actual active content is. Polymers are normally used in solutions of about 0.10 – 0.25% concentration.
Equipment
Buchner funnel
Vacuum (sidearm) flask
Filter Paper for Buchner funnel
Vacuum pump
Balance
Syringes or small pipettes for chemical addition
To make up a dry polymer, use the following procedure:
- Weigh either 0.5 gm of dry polymer
- Wet the polymer with either 50 ml of acetone
- With constant mixing add 450 ml in roughly equal portions making sure the polymer fully dissolves and is mixed thoroughly before adding the second portion
- After thoroughly mixing the polymer, allow it to stand without mixing for at least 30 minutes or as recommended by the polymer vendor.
To make up a liquid or dispersion polymer, use the following procedure:
- Add either 1 ml of polymer using a syringe or pipette to 1000 ml of water with constant mixing
- After thoroughly mixing the polymer, allow it to stand without for at least 30 minutes or as directed in the manufacturer’s instructions.
Procedure
- Make up and properly age each polymer solution per above.
- Obtain a representative sample of the slurry to be tested
- Determine the feed solids and pH of the slurry. If a laboratory sample is needed collect a 1 liter sample for analysis
- If necessary, adjust the pH to be the range of 6 – 8 unless the polymer to be tested is known to work at the slurry pH. Most polymers work very well at essentially a neutral pH.
- Using a 250 ml slurry sample, add the chemical conditioning per Table 1.
- Add the polymer to the slurry and mix thoroughly
- Assemble Buchner funnel and attach to vacuum pump
- Place filter paper on the funnel and wet the paper
- Apply the vacuum
- Start timing when the slurry is added to the funnel
- Stop the test when all the liquid has been pulled through the paper into the flask
- Record the volume and elapsed time and note the filtrate quality (see Table 3)
- Disassemble the unit and inspect the cake and cake release (see Table 3)
- Repeat steps 3 through 13 varying the polymer dosages.
- If none of the polymers is satisfactory raise or lower the polymer dose based on the data collected
Technique Notes
- To make up a smaller or larger amount of polymer solution scale according (half, double, etc.) to the volume ratio with the procedure above.
- Several different polymers should be tested to determine the best polymer for the slurry.
- If one is unfamiliar with the best polymers to test, contact the field support staff of the polymer vendor for advice and samples.
- A useful test of floc strength is to squeeze some of the floc with one’s hands and if the floc remains intact it has a reasonable strength
- An alternate test of floc strength is to vigorously stir the floc by hand or on a magnetic stirrer for 1 – 2 minutes. If the floc is weak, it will fall apart and the sample will appear to be untreated.
- Polymer solutions normally have a density of 1 gm/ml (the same as water)
- The change of filtration time vs. Polymer dose must be determined for a range of dosages
- Polymers are only effective over a dose range, the width of this range is as important as the actual polymer dose
- Liquid and emulsion polymers have an active polymer content from about 30 to 50% w/w
- Dry polymers usually must be wetted with acetone to ensure proper dissolution in water.
- Typically polymer solutions are aged about 30 – 60 minutes, consult manufacturer’s literature for their recommendations.
- Sometimes the effectiveness of the polymer can be improved by adding a small amount of ferric chloride to the slurry before adding the polymer.
Table 1. Recommended Polymer Dosages for CST Testing
| Dose gm/kg of dry slurry solids | Dose lbs/ton of dry slurry solids |
| 2.5 | 5 |
| 4 | 8 |
| 5 | 10 |
| 6 | 12 |
| 7.5 | 15 |
| 10 | 20 |
Calculations
Slurry Dry Solids:
Slurry Volume, ml × Slurry Density, gm/ml × Slurry Feed Solids = Slurry Dry Solids, gm
Conversion to Kilogram:
Slurry Dry Solids, gm / 1,000 gm/kg = Slurry Dry Solids, kg
“Dry” Polymer Mass Required:
Slurry Dry Solids, kg × Polymer Dose gm/kg = Polymer Solids, gm
Polymer Solution Mass Required:
(Polymer Solids, gm / Polymer Concentration, %) × 10 = Solution Mass, gm
Volume of Polymer Solution Required:
Solution Mass, gm / Solution Density, gm/ml = Polymer Solution Volume, ml
Example
Slurry Volume 25 ml
Slurry Feed Solids 5%
Slurry Density 1.02 gm/ml
Polymer Dose 5 gm/kg
Polymer Concentration 0.2%
Slurry Dry Solids:
25 ml × .05 × 1.02 gm/ml = 1.28 gm of slurry dry solids
Conversion to kg:
1.28 gm / 1000 gm/kg = 0.00128 gm
Mass of Polymer Required:
0.00128 kg × 5 gm/kg = 0.00638 gm of polymer required
Polymer Solution Mass:
(0.00638 gm / 0.2 %) × 100 = 3.2 gm of polymer solution required
Polymer Solution Volume:
3.2 gm / 1.00 gm/ml = 3.2 ml of polymer solution required
Interpretation
The stability and strength of the polymer floc is critical. This is usually evaluated by vigorous mixing of the conditioned sample for about 2 minutes and observing the resulting floc. The less the floc visually changes the stronger and more stable the floc and the more likely a good filter cake can be made in a filter press. The “beaten” floc can be tested to see how much the time did change.
The shorter the time required for filtration the more filterable the slurry is.
Very thick cakes are prone to have tacky tops and very hard bottom layers. This may mislead an inexperienced analyst to conclude that more conditioning is needed when in fact the slurry will dewater very well in filter press. One may conclude that more conditioning is needed when in fact the slurry will dewater very well in filter press. Thinner cakes are more consistent throughout than very thick cakes.
Sometimes cakes will crack during the test and typically will be damp on top and very hard on the bottom. The dampness does not indicate that poor cakes will be made. Cracking is caused by cake contraction as it air dries and is normally seen for conditions where the slurry will filter extremely well. The filtrate quality usually improves faster than the cake quality because the paper used is tighter than the typical filter cloth.
The cake release from the paper is a good indication of the stickiness of the cake to filter cloth. Tacky cakes release poorly from both the paper and the cloth. If the filter press can achieve a drier cake than the Buchner funnel, the cake release may improve on the filter press.
6.3.3 Other Conditioning with the Buchner Funnel
Chemicals
Ferric chloride solution of known concentration and density, typically we use a commercially available ferric chloride solution of 36% that has a density of 1.378 gm/ml.
Hydrated lime, chemical grade with analysis of 90 – 95 % as Ca(OH)2 or 68 – 72 % available CaO
The hydrated lime should be made up in a 10% w/w slurry to add to the slurry. Normally lime is added to slurry in a 10 – 15% w/w slurry. The density of the 10% slurry is 1.08 gm/ml
Other inorganic chemicals such as alum as specified by the customer.
Equipment
Buchner funnel
Vacuum (sidearm) flask
Filter Paper for Buchner funnel
Vacuum pump
Balance
Syringes or small pipettes for chemical addition
Procedure
- Obtain a representative sample of the slurry that will be used for the filter press testing.
- Determine or obtain the feed solids and pH of the slurry. If a laboratory sample is needed collect a 1 liter sample for analysis.
- Using a 250 ml slurry sample, add the chemical conditioning per Table 2.
- Add ferric chloride to the slurry and mix thoroughly
- Add the lime slurry to the slurry and mix thoroughly
- Assemble Buchner funnel and attach to vacuum pump
- Place filter paper on the funnel and wet the paper
- Apply the vacuum
- Start timing when the slurry is added to the funnel
- Stop the test when all the liquid has been pulled through the paper into the flask
- Record the volume and elapsed time and note the filtrate quality (see Table 9)
- Disassemble the unit and inspect the cake and cake release (see Table 9)
- Repeat steps 3 through 12 varying the chemical conditioning dosages.
- If the recommended dosages do not give a satisfactory cake and filtrate, vary the chemical conditioner dosages based on the direction of the best cake and filtrate observed repeating steps 3 through 12 with the new dosages.
- If there is information indicating that different dosage ranges should be examined test these ranges then, if necessary, test either the recommended ranges of other ranges as outline in step 14.
Note: That chemical dosages are conventionally reported for ferric chloride and lime on a w/w%, dry solids basis. See calculations for determining actual volumes of “solution” to be added.
Table 2. Recommended Chemical Dosages for Buchner Funnel Tests
| Test | Ferric Chloride Dose % | Lime Dose As CaO % |
| 1 | 0 | 0 |
| 2 | 5 | 20 |
| 3 | 5 | 25 |
| 4 | 5 | 30 |
| 5 | 6.5 | 20 |
| 6 | 6.5 | 25 |
| 7 | 6.5 | 30 |
| 8 | 8 | 20 |
| 9 | 8 | 25 |
| 10 | 8 | 30 |
| 11 | 10 | 20 |
| 12 | 10 | 25 |
| 13 | 10 | 30 |
| 14 | 10 | 35 |
Table 3. Description of Ratings for Filtrate, Cake, and Cake Release
| Rating | Filtrate Quality | Cake Quality | Cake Release |
| 1 | Looks like unfiltered slurry | No cake formed or unfiltered slurry on top of cake | No cake |
| 2 | Very dirty | Cake is very soft, can squeeze water out of cake by hand | Cake sticks to the paper and must scrapped off the paper |
| 3 | Dirty | Bottom cake is firm but most of the cake is soft | Cake releases from about half of the paper |
| 4 | Small amount of visible solids | Cake is mostly firm, top is tacky | Cake releases from almost all the paper |
| 5 | Clear, no visible solids | Cake is firm throughout | Cake releases from the paper |
Technique Notes
- Dilute slurries will form very thin cakes. If the cakes are too thin blinding may not be seen when it will occur in a filter press
- Minimum cake thickness to observe blinding is about ¼ in.
- The vacuum test does not always accurately predict the behavior of a pressure filter such as a filter press.
- Wet the paper and turn on the vacuum before adding the sample insures that there is a good seal
Calculations
Slurry Dry Solids:
Slurry Volume, ml × Slurry Density, gm/ml × Slurry Feed Solids = Slurry Solids, gm
“Dry” Chemical Mass Required:
Slurry Dry Solids, kg × Chemical Dose, gm/kg = Chemical Solids, gm
Chemical “Solution” Mass Required:
(Chemical Solids, gm / Chemical Concentration, %) × 100 = Chemical Mass, gm
Volume of Chemical “Solution” Required:
Chemical Mass, gm / Chemical Density, gm/ml = Chemical Solution Volume, ml
Example – Using Ferric Chloride (FeCl3)
Slurry Volume 250 ml
Slurry Feed Solids 5%
Slurry Density 1.02 gm/ml
Ferric Chloride Dose 6%
Ferric Chloride Concentration 36%
Ferric Chloride Density 1.378 gm/ml
Slurry Dry Solids:
250 ml × 0.05 × 1.02 gm/ml = 12.8 gm of dry solids
“Dry” Chemical Mass Required:
12.8 gm × 0.06 = 0.77 gm of “Dry” Ferric Chloride
Chemical “Solution” Mass Required:
(0.77 gm × 100) / 36 % = 2.13 gm of solution required
Volume of Chemical “Solution” Required:
2.13 gm / 1.387 gm/ml = 1.6 ml of Ferric Chloride Solution required
Interpretation
The shorter the time required for filtration the more filterable the slurry is.
Very thick cakes are prone to have tacky tops and very hard bottom layers. This may mislead an inexperienced analyst to conclude that more conditioning is needed when in fact the slurry will dewater very well in filter press. One may conclude that more conditioning is needed when in fact the slurry will dewater very well in filter press. Thinner cakes are more consistent throughout than very thick cakes.
Sometimes cakes will crack during the test and typically will be damp on top and very hard on the bottom. The dampness does not indicate that poor cakes will be made. Cracking is caused by cake contraction as it air dries and is normally seen for conditions where the slurry will filter extremely well. The filtrate quality usually improves faster than the cake quality because the paper used is tighter than the typical filter cloth.
The cake release from the paper is a good indication of the stickiness of the cake to filter cloth. Tacky cakes release poorly from both the paper and the cloth. If the filter press can achieve a drier cake than the Buchner funnel, the cake release may improve on the filter press.